Crazy Time Statistics: Live Data and Outcome Tracking
This page shows live statistics from Crazy Time's 24/7 broadcast (sometimes searched as crazytime stats) including recent spin history, per-segment hit frequencies, bonus round trigger rates, Top Slot alignment events, and per-bonus outcome distributions. Data updates continuously from a same-origin live provider API.
Important framing: the statistics on this page are descriptive of what has already happened, not predictive of what will happen next. Each spin is independent under the certified RNG; past outcomes don't change future probabilities. This page explains how to read the data accurately and why "hot" or "cold" segments don't predict the next spin.
Practise Crazy Time in the demo: free, no real-money risk, no stat-watching pressure.
Play Crazy Time: operator checklist before real-money play. 18+. Play responsibly. BeGambleAware.
- Updated
- 25 May 2026
- Sections
- 16
- Focus
- No prediction claims

Section 01
At a Glance
The data shown on this page covers:
- Live spin history: the most recent spins as they happen, including outcome and Top Slot result
- Per-segment hit frequency: how often each of the 8 wheel outcomes has occurred over selectable time windows
- Bonus round trigger rates: observed frequency of Cash Hunt, Coin Flip, Pachinko, and Crazy Time bonus triggers vs theoretical 3.70% / 7.41% / 3.70% / 1.85%
- Per-bonus outcome distributions: multiplier ranges hit per bonus type (e.g., where Cash Hunt picks have landed, what Pachinko chains have produced)
- Top Slot alignment events: when bet reel and main wheel have both landed on the same outcome
- Recent verified big wins: large multipliers observed in the live broadcast with context
- Time since last bonus: how long since each of the 4 bonus rounds last triggered
The data shown on this page does NOT predict:
- Which segment the wheel will land on next
- When a bonus round will trigger
- Whether a "due" segment is more likely to hit
- Whether a "hot" segment will continue to hit
- Whether a recent chain or big win pattern will repeat
Worth being explicit: the data is historical record-keeping, not a forecasting tool. The next block explains why this distinction matters mathematically.

Section 02
What This Page Shows
This statistics page is built on a same-origin live provider API connected to the live Crazy Time broadcast from Evolution Gaming's studio in Riga, Latvia. The data flows through the following pipeline:
Data source
- Evolution Gaming's live Crazy Time broadcast: the same broadcast UK players see at UK-licensed operators
- Same-origin live provider API: outcomes captured directly from the live stream as they happen
- Refresh rate: continuous updates as new spins complete (refresh interval typically 5-15 seconds depending on the metric)
- Coverage: 24/7 to match the live broadcast's continuous operation
Data captured per spin
- Spin timestamp: when the spin occurred
- Main wheel outcome: which of the 8 segments the flapper landed on
- Top Slot outcome: which bet reel position and multiplier value were generated
- Bonus details (where applicable): which presenter ran the bonus, what outcome was reached, chain length for Pachinko/Crazy Time bonus, pick position for Cash Hunt, coin side selected for Coin Flip
- Final multiplier: the multiplier applied to any winning bets
What this isn't
- Not a personal tracker / session tracker: the data covers the public live broadcast, not individual visitor bets. If you want to track your own play history, that's a separate function (and one this site doesn't currently provide)
- Not a substitute for the live stream: see the live page for watching the broadcast directly
- Not an operator-specific tracker: outcomes are the same across all UK-licensed operators because they all stream the same Evolution feed
- Not predictive analytics: see the next block on why
Comparison to third-party trackers
Other stats trackers exist for Crazy Time, notably Tracksino. The same-origin live provider API on this page offers several differences:
- Direct from the broadcast: no third-party intermediary
- Anti-predictive editorial framing: third-party trackers typically don't include explicit anti-prediction context
- UK-focused responsible gambling integration: stats-watching harm framing built in
- Cross-referenced with the site's other content: each stat ties back to the relevant mechanic explanation
Tracksino and similar trackers remain useful comparison sources for historical aggregates. The data here, the data on Tracksino, and the data on similar trackers should agree (all observe the same live broadcast); differences typically reflect refresh timing or counting methodology.

Data check
Stats Are Not Predictive
This is the most important framing on the page. Crazy Time statistics are descriptive of past outcomes; they do not predict future outcomes. Worth being explicit about why.
Each spin is independent under the certified RNG
- The wheel's outcome each spin is determined by the certified mechanic (RNG + physical wheel + flapper)
- No spin remembers previous spins: there is no mechanism by which the wheel adjusts its probabilities based on history
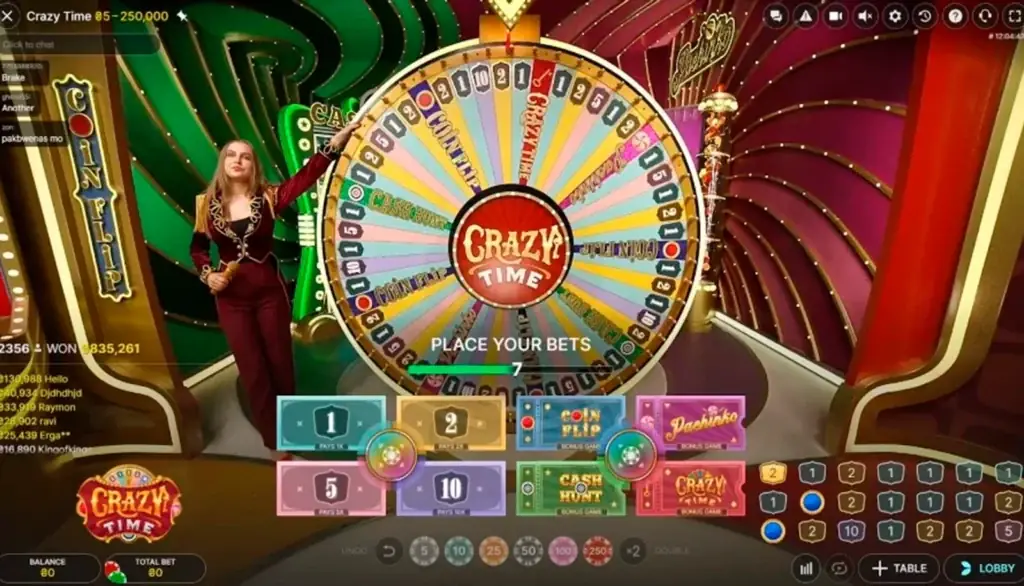
- Per-segment probabilities are fixed by the wheel design (21 segments at 1×, 13 at 2×, 7 at 5×, 4 at 10×, 4 at Coin Flip, 2 at Cash Hunt, 2 at Pachinko, 1 at Crazy Time bonus)
- Probabilities reset every spin: there's no "weighting" toward outcomes that haven't appeared recently
The gambler's fallacy
The gambler's fallacy is the belief that recent outcomes affect future probabilities in independent events. Specifically:
- "Red has hit 5 times in a row, so black is due" (roulette example), wrong; each spin is independent
- "Pachinko hasn't triggered in 40 spins, so it's overdue", wrong; 3.70% probability applies to the next spin regardless of history
- "Cash Hunt just gave out 500×, so it won't give that again for a while", wrong; outcomes are independent
- "The Crazy Time bonus is hot today", descriptively maybe true (it triggered more than average recently); predictively meaningless
This fallacy is the most common stats-tracker misuse in gambling-adjacent contexts. The hot/cold language used in stats tracking can reinforce this fallacy if not framed carefully.
Regression to the mean, not gambler's fallacy
Worth distinguishing two concepts often confused. Regression to the mean is a real statistical phenomenon: extreme observations in small samples tend to be followed by less extreme observations as more data accumulates (because the overall sample includes both the extreme observation and the new less-extreme ones, averaging them out). The gambler's fallacy is the false belief that the next individual outcome will compensate for recent extreme outcomes.
These sound similar but are different. Regression to the mean operates over aggregate samples; the gambler's fallacy is wrong about individual events. If 1× has hit 50% in the last 100 spins (extreme observation), regression to the mean predicts that the 200-spin sample will show observed 1× closer to 38.89% (because the next 100 spins contribute new data averaged in). The gambler's fallacy would predict that 1× must hit less than 38.89% in the next 100 spins to "compensate", which is wrong; each spin remains 38.89%.
What "hot" and "cold" actually mean
- "Hot" segment = a segment that has hit more than its theoretical frequency in the recent observation window
- "Cold" segment = a segment that has hit less than its theoretical frequency in the recent observation window
- What this means: a description of recent history (i.e., variance has gone one way over the sample)
- What this does NOT mean: a prediction that the hot segment will continue or that the cold segment will catch up
A hot segment over the last 100 spins has the same probability as a cold segment of hitting on spin 101. The probabilities are fixed by the wheel design, not adjusted by recent history.
Why this framing matters
Stats-watching can drift into pattern-seeking. Pattern-seeking can drift into "I'll bet on the cold segment because it's due." That betting approach has no mathematical support: it gives the house the same edge as any other approach. Across many sessions, "due" betting loses at the same long-term rate as any other betting approach.
For deeper coverage of why no betting system beats the house edge, see Crazy Time strategy: honest bankroll and math guide. For the broader gambler's fallacy framing, see hot and cold segment myths on the strategy page.
The honest framing for everything below
Every stat displayed below the next block is descriptive of the past. None of it predicts the future. The data is interesting (it shows how the certified mechanic produces outcomes over time, it reveals variance shape, it captures memorable events), but it does not give you actionable betting signals. If you find yourself making betting decisions based on what the data shows, you've drifted from descriptive use into predictive use, and predictive use is where stats-watching becomes a harm pattern.

Live table
Live Spin History
This block shows the most recent Crazy Time spins from the same-origin live provider API when available. Rows are historical and descriptive: outcome, multiplier, Top Slot context, and any bonus detail already settled by the broadcast.
If the live feed is temporarily delayed, cached rows remain visible where possible and refresh shortly.
Live table
Outcome Frequency by Segment
This section compares observed segment frequency against the fixed wheel distribution. Observed percentages can move above or below theory over short windows; that variance does not predict the next spin.
| Segment | Theoretical % | Segments on wheel |
|---|---|---|
| 1 | 38.89% | 21 of 54 |
| 2 | 24.07% | 13 of 54 |
| 5 | 12.96% | 7 of 54 |
| 10 | 7.41% | 4 of 54 |
| Coin Flip | 7.41% | 4 of 54 |
| Cash Hunt | 3.70% | 2 of 54 |
| Pachinko | 3.70% | 2 of 54 |
| Crazy Time bonus | 1.85% | 1 of 54 |
Live context
Bonus Round Frequency: Observed vs Theoretical
The four bonus rounds occupy 9 of 54 wheel segments combined, so some bonus appears on roughly 16.7% of spins over a large enough sample. The synced summary below shows observed recent counts when available.
Short windows can look lumpy. A bonus being absent for a while does not make it due.

Game mechanic
Per-Bonus Outcome Distribution
Once a bonus round triggers, the outcome distribution depends on that bonus mechanic. Use the dedicated bonus guides for static mechanics, then treat any synced stats as historical context only.
- Cash Hunt: hidden target pick after reveal and shuffle.
- Coin Flip: red/blue side multipliers and Rescue Flip behaviour.
- Pachinko: puck drop, DOUBLE zones, and final slot value.
- Crazy Time bonus: flapper choice, wheel spins, and chain multipliers.

Live context
Top Slot Alignment Tracking
The Top Slot generates a bet-reel position and multiplier independently of the main wheel. When the bet-reel position matches the outcome you backed and the main wheel also lands there, the Top Slot multiplier can compound the payout.
The synced summary below is descriptive only. Alignment events are rare and do not make future alignments more or less likely.

Section 09
Recent Big Wins from the Data Feed
Recent large-multiplier rows are synced from the same-origin live provider API where available. During temporary sync delays, the page should keep cached rows or show a soft syncing state rather than technical errors.
Large recent multipliers are useful for understanding variance, not for timing bets.

Game mechanic
Time Since Last Bonus Trigger
Time-since-last-bonus data can be interesting, but it is also one of the easiest stats to misuse. A bonus being absent for many spins does not make it due; every spin is independent under the certified game design.
Use this context to understand variance and streaks, not to escalate stakes or chase a missing bonus.

Data check
Sample Size and Convergence
The data on this page shows observed percentages over selectable time windows. Worth understanding how observed percentages relate to theoretical percentages at different sample sizes.
The law of large numbers and RTP convergence
Over enough spins, observed percentages converge to theoretical percentages, and observed RTP converges toward the published 96.08% headline figure. This is the law of large numbers, one of the foundational results in probability theory. Applied to Crazy Time:
- Per-segment probabilities are fixed by the wheel design
- Each spin's outcome is determined randomly within those fixed probabilities
- Across many spins, observed frequencies approach the underlying probabilities
- The rate of convergence depends on sample size; convergence is slower than people often expect
Sample size and expected deviation
Rough expected deviation between observed and theoretical at different sample sizes:
| Sample size | Expected deviation for 1× (38.89% theoretical) | Expected deviation for Crazy Time bonus (1.85% theoretical) |
|---|---|---|
| 100 spins | ±5 percentage points (typical range: 34-44%) | bonus may appear 0-5 times (vs theoretical ~2) |
| 1,000 spins | ±1.5 percentage points (typical range: 37-41%) | bonus appears typically 12-26 times (vs theoretical ~18) |
| 10,000 spins | ±0.5 percentage points (typical range: 38.4-39.4%) | bonus appears typically 165-205 times (vs theoretical ~185) |
| 100,000 spins | ±0.15 percentage points (typical range: 38.74-39.04%) | bonus appears typically 1,800-1,900 times (vs theoretical ~1,850) |
These are rough expected ranges based on standard binomial probability calculations (specifically: standard deviation = √(n × p × (1-p)), where n is sample size and p is per-spin probability). Actual observations within these ranges are normal.
Why this matters for reading the stats
- A 100-spin sample showing 1× at 35% is normal variance, not evidence of the wheel being "off"
- A 1,000-spin sample showing Crazy Time bonus 12 times is normal variance, not evidence of the bonus being "rigged against players"
- A 10,000-spin sample matching theoretical to within 1 percentage point is exactly what the math predicts
- The wheel doesn't need to "correct" deviations; over enough spins, observed approaches theoretical because that asks the math
Why this doesn't predict the future
The law of large numbers says over many spins, observed approaches theoretical. It does NOT say on the next spin, the previous deviations will be corrected.
- A segment that's been observed at 30% over 100 spins (vs 38.89% theoretical) doesn't need to "catch up" on spin 101
- The probability for the next 100 spins is 38.89%, applied independently to each spin
- Across the next 10,000 spins, the combined sample will likely show observed close to theoretical (because 10,100 spins dominates the 100-spin deviation)
- But this is convergence over large samples, not adjustment of individual spin probabilities
For more on the math of expected loss across sample sizes, see the RTP page.

Data check
How to Actually Use These Stats
If stats aren't predictive, what good are they? They're useful in several ways that don't involve betting prediction.
Useful: understanding game design
The stats let you see Evolution's certified mechanic working in practice:
- The 8 outcome types match their wheel-count proportions over large samples (validating the certified design)
- Bonus round trigger rates approach 3.70% / 7.41% / 3.70% / 1.85% over large samples (validating the documented rates)
- Top Slot alignment frequencies match the 1-in-8 model (validating the integration mechanic)
- Per-bonus outcome distributions match the documented variance profiles (validating the per-bonus mechanic specifications)
This is useful curiosity-driven understanding, not actionable betting information.
Useful: variance shape intuition
Watching stats over time builds variance intuition. The aggregate observed RTP should converge toward 96.08% (headline) over very large samples. Several specific patterns become visible:
- Coin Flip's tight distribution becomes visible in the per-bonus outcome data
- Cash Hunt's wide single-pick variance becomes visible in the multiplier distribution
- Pachinko's chain-shaped variance becomes visible in chain-length tracking
- Crazy Time bonus's deeper compounding variance becomes visible in extended chain events
This intuition helps you understand what to expect from each bonus, which can support better personal expectations management (and therefore better responsible gambling outcomes, knowing that big wins are rare events makes their absence in any session less distressing).
Useful: verifying the certified mechanic
The stats let you check that the game is operating according to the certified specification:
- If observed RTP over very large samples (50,000+ spins) substantially deviates from the 96.08% headline RTP, that would be worth investigating (the certification chain would need to examine the mechanic)
- If observed per-segment frequencies substantially deviate from theoretical over very large samples, that would similarly warrant investigation
- If observed Top Slot integration math substantially deviates from the 1-in-8 model, similar
In practice, observed data from Crazy Time matches the certified specification closely over large samples. The certification process (GLI + eCOGRA + iTech Labs + BMM Testlabs per UKGC requirements) is rigorous, and the certified design produces the documented outcomes.
Useful: educational reference
The stats page is a teaching tool for probability concepts:
- Independence of events (each spin doesn't remember previous spins)
- Law of large numbers (convergence over large samples)
- Variance vs expected value (short-run noise vs long-run trends)
- Sample size and confidence (small samples deviate; large samples don't)
These are transferable probability concepts applicable beyond Crazy Time.
NOT useful: betting prediction
Reasserting the core framing: the stats are not useful for betting prediction. Not for:
- Which segment to bet on next
- When a bonus is "due" to trigger
- Whether a hot/cold pattern will continue or reverse
- Whether a recent big-win pattern will repeat or stop
- Any other predictive application
The math doesn't support predictive use. Trying to use the stats predictively gives the house the same long-term edge as any other betting approach (5.92%, the headline house edge).

Data check
Stats vs Strategy
Statistics and strategy are connected but distinct concepts. Worth being clear about the difference.
What statistics describe
- What has happened over selected time windows
- The shape of variance as it played out
- The frequency of specific events in the observation period
- Aggregate metrics like observed RTP over the window
Statistics are descriptive: they tell you what occurred.
What strategy is (supposed to be)
- A set of decisions that change long-term outcomes
- An approach that beats or matches the house edge over many sessions
- Choices based on actionable information about future outcomes
- Pattern-spotting that translates to profitable bet selection
Why there's no strategy in Crazy Time
The fundamental issue: there's no actionable information about future outcomes in Crazy Time. Each spin is independent. Per-segment probabilities are fixed. The house edge applies to every bet regardless of selection or timing.
Therefore:
- Statistics describe the past ✓ (this is what stats do)
- Statistics don't predict the future ✓ (mathematical fact)
- No strategy beats the house edge ✓ (because no actionable predictive information exists)
- Therefore, stats don't enable strategy ✓ (descriptive data + no predictive use = no strategy enabled)
What you CAN strategize about
The only meaningful "strategy" in Crazy Time is bankroll and behaviour management, which doesn't require stats:
- Bet sizing: stake amount calibrated to your bankroll, not to recent stats (staking discipline matters more than stat-tracking)
- Session limits: pre-committed time and money limits, not adjusted based on hot/cold patterns
- Bet selection: a personal preference (which outcomes you bet on), not optimised by stat-tracking
- When to stop: pre-committed stop triggers (e.g., session loss limit hit), not based on "the bonus is due"
These don't need the live data on this page. They need an honest assessment of how much you're willing to spend on entertainment.
For the full strategy framework, see Crazy Time strategy: honest bankroll and math guide.
Why some players insist stats enable strategy
The persistence of "stats-based strategies" in gambling content reflects:
- Cognitive bias (pattern-recognition instinct that doesn't apply to independent events)
- Survivorship bias (people who won using a "system" remember the wins; those who lost don't write tutorials)
- Confirmation bias (a system that "works" sometimes is remembered as working; the times it fails are dismissed as bad luck)
- Industry incentives (gambling content that promises "winning systems" gets more clicks than content explaining that no system works)
The math doesn't care about these biases. The house edge applies to every bet, every spin, every session.

Player safety
Responsible Gambling and Statistics
Stats-watching is a distinct gambling behaviour with its own harm vector. Worth being explicit about how this manifests and what to do about it.
The stats-watching harm pattern
A typical escalation:
- A player starts using stats-tracking sites casually (out of curiosity)
- The stats reveal "patterns" that look meaningful (hot streaks, cold droughts, alignment clusters)
- The player starts betting based on the perceived patterns ("the cold segment is due")
- Sessions stretch longer because stats-watching creates engagement
- Bets escalate because perceived patterns feel actionable
- The math doesn't actually support the pattern-based betting; losses accumulate
- The player attributes losses to "bad timing" rather than to the fundamental issue (stats aren't predictive)
- The pattern repeats; cumulative losses grow
This pattern is mathematically distinct from chasing-the-25,000× (Cash Hunt harm), session-length escalation (Coin Flip harm), or chain-extension anticipation (Pachinko harm). It's a stats-driven harm vector specific to serious stats-watchers.
Recognising the stats-watching harm pattern
Warning signs:
- Spending more than a few minutes per session checking stats before betting
- Adjusting bet sizes based on stats (betting more when "patterns" look favourable)
- Tracking your own bet outcomes in detail (often with the assumption that detail enables system improvement)
- Returning to the stats page repeatedly during a session to check for updates
- Frustration when patterns don't continue ("I was sure the cold segment was due")
- Time disappearing into stats-checking (sessions extending well beyond planned duration)
What honest stats use looks like
- Brief check before or after a session (curiosity, not pattern-spotting)
- Recognising stats are descriptive (no betting decisions based on hot/cold)
- Bankroll and session limits set independently of stats (pre-committed, not adjusted based on data)
- Periodic check to verify the certified mechanic is performing as documented (educational interest)
- Reading stats as entertainment rather than as actionable signals
Free UK support if stats-watching has become a problem
- BeGambleAware (0808 8020 133, free 24/7 helpline) or begambleaware.org
- GamCare (gamcare.org.uk): free counselling
- GAMSTOP (gamstop.co.uk): UK-wide self-exclusion
- Gambling Therapy (gamblingtherapy.org): global online support
- Citizens Advice (citizensadvice.org.uk): financial difficulty support
Site design choices reflecting RG awareness
- This page leads with anti-predictive framing before any data is displayed
- The time-since-last-bonus widget includes explicit anti-fallacy framing
- Every per-data block reasserts "this is descriptive, not predictive"
- No "predicted outcomes" or "recommended bets" anywhere
- No prompts to spend more time on the page or extend sessions
- Cross-links to RG resources prominent
For the full responsible gambling framework, see responsible gambling: UK support resources and limit-setting.

Quick answers
Frequently Asked Questions
Short answers are opened with native details controls, so the page stays crawlable and keyboard-friendly without extra JavaScript.
Are the statistics on this page predictive?
No. The statistics are descriptive of past outcomes only. Each Crazy Time spin is independent under the certified RNG; past outcomes don't change future probabilities. Using the stats for betting prediction is the gambler's fallacy.
Where does the data come from?
The data comes from a same-origin live provider API connected to Evolution Gaming's live Crazy Time broadcast from the Riga studio. The same broadcast is streamed across all UK-licensed operators offering Crazy Time, so the outcomes are universal.
How often do the stats update?
The live spin history widget updates as new spins complete (typically every 60-90 seconds during normal play). Aggregate data (per-segment frequency, bonus frequency, alignment tracking) refreshes every 1-5 minutes depending on the metric.
Why don't observed percentages exactly match theoretical?
Variance. Over small samples, observed percentages deviate from theoretical due to random variation. The law of large numbers says observed converges to theoretical over very large samples (10,000+ spins), but small-sample deviations are normal. See sample size and convergence for the math.
What's a "hot" or "cold" segment?
- Hot segment: hit more than its theoretical frequency in the recent observation window
- Cold segment: hit less than its theoretical frequency in the recent observation window
These are descriptions of past variance, not predictions of future outcomes. A hot segment doesn't keep being hot; a cold segment doesn't "catch up". Probabilities reset every spin.
Should I bet on the segment that hasn't hit in a while?
No. This is the gambler's fallacy. A segment's per-spin probability is fixed by the wheel design (e.g., 1× at 38.89%, Crazy Time bonus at 1.85%) regardless of how long it's been since it last hit. Betting "due" segments gives the house the same long-term edge as any other betting approach.
How is this different from Tracksino?
Tracksino is a third-party tracker covering Crazy Time and other Evolution game shows. The same-origin live provider API on this page offers: provider-synced broadcast capture (no intermediary), anti-predictive editorial framing (Tracksino doesn't explicitly debunk predictive misuse), UK-focused responsible gambling integration, and cross-references to the site's other content. Tracksino remains a useful comparison source; data from both should agree because they observe the same broadcast.
Can I trust the data feed?
The data feed captures outcomes directly from the live broadcast. Yes, it's accurate within the refresh interval. Cross-verification against Tracksino, against the live broadcast directly, or against UK-licensed operator session history should agree (small timing variations may occur but the outcomes themselves are consistent).
Why does this page warn against using stats predictively?
Because stats-watching is a documented harm pattern in gambling. Stats trackers can drift into pattern-spotting and predictive misuse, which has no mathematical support but can drive escalation. The editorial choice to build anti-predictive framing into the page design (rather than just present data and let visitors fall into the fallacy) reflects the site's responsible gambling commitment. See responsible gambling and statistics.
What can I actually use these stats for?
Several things, none of them betting prediction:
- Understanding game design (validating the certified mechanic against theoretical)
- Building variance intuition (seeing what different bonus shapes look like in practice)
- Educational reference for probability concepts (independence, law of large numbers, sample size)
- Verifying the certified mechanic is operating as documented (over very large samples)
- Curiosity-driven engagement with the broadcast
For betting decisions, see Crazy Time strategy: honest bankroll and math guide for the bankroll framework that doesn't depend on stats.